Statistical Process Control (SPC) is a powerful tool used by industries to monitor and manage their processes, ensuring consistency and quality in production.
At the heart of SPC lies the concept of normal distribution, also known as the Gaussian or the bell curve. Understanding the characteristics and implications of this aspect is essential for effective process control and optimization.
What is Normal Distribution?
It is a fundamental concept in statistics and probability theory, characterized by a symmetric bell-shaped curve. In this curve, the majority of data points cluster around the mean (average) value. In a perfectly bell curve, the mean, median, and mode are all equal, and its mean and standard deviation fully define the curve.

The Importance of Normal Distribution in Statistical Process Control
Identifying Process Variability
In SPC, the goal is to identify and minimize process variability. When data follows a bell curve, analysts can effectively use statistical techniques to understand process behavior. Deviations from normality may indicate process instability, prompting further investigation and corrective actions.
Establishing Control Limits
Control charts are a fundamental tool in SPC, used to monitor process variation over time. Assuming a normal curve allows for accurate calculation of control chart limits based on the mean and standard deviation of the data. Control limits act as boundaries, indicating the acceptable range of variation for a stable process.
Accurate Process Capability Analysis
Process capability analysis assesses how well a process can produce products within specified limits. By assuming a Gaussian curve, capability indices like Cp, Cpk, Pp, and Ppk can be calculated. These indices provide a clear understanding of a process’s ability to meet requirements. This information is crucial for process improvement efforts and setting realistic production targets.
Efficient Root Cause Analysis
The assumption of normality enables the use of various statistical tests and methods, making it easier to pinpoint the source of variations and implement effective solutions.
Sample Size Determination
In SPC, selecting an appropriate sample size is vital to achieve reliable results. When data follows a Gaussian curve, sample size determination becomes more straightforward, leading to accurate inferences about the entire population.
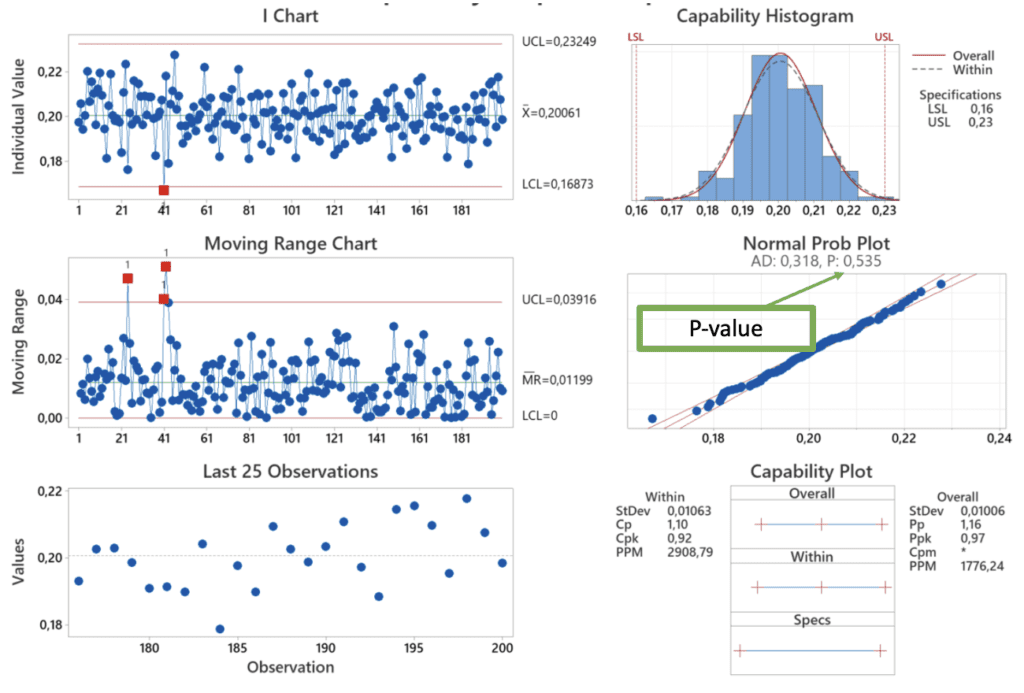
What is the connection between the p-value and the normal distribution?
In the context of hypothesis testing, statisticians closely connect the p-value with the Gaussian distribution. This connection is particularly evident when conducting tests based on the t-distribution or the standard normal distribution (Z-distribution).
In hypothesis testing, researchers or statisticians aim to draw conclusions about a population based on a sample. The p-value represents the probability of obtaining results as extreme as the ones observed in the sample, assuming that the null hypothesis is true.
The null hypothesis (H0) typically represents the default assumption, such as “there is no difference” or “there is no effect”. The alternative hypothesis (Ha) represents the claim or effect we are testing. It often states that there is a significant difference or effect.
The Role of Sample Size in Hypothesis Testing
When the sample size is sufficiently large (usually considered n > 30), and the data meet certain conditions, the Central Limit Theorem comes into play. It states that the distribution of sample means (or other statistics) will tend to follow a Bell curve, even if the original data did not come from this curve.
Researchers or statisticians calculate the test statistic using the sample data in hypothesis testing. Its distribution depends on the sample size and the underlying population distribution. When the sample size is large, and the population follows a Gaussian distribution (or approximately normal), the test statistic follows a Z-distribution.
However, when the population standard deviation is unknown, and the sample size is small (typically n < 30), the t-distribution is used instead. The t-distribution is similar to the Z-distribution but has fatter tails, accounting for the increased uncertainty in small samples.
Researchers then calculate the p-value based on the test statistic and its associated distribution (either Z or t). For a one-tailed test, the p-value represents the area under the curve in the tail(s) beyond the observed test statistic. For a two-tailed test, it represents the probability of observing test statistics as extreme or more extreme in either tail.
If the p-value is small – typically less than the chosen significance level, commonly 0.05. It indicates that the observed results are unlikely to occur by chance if the null hypothesis is true. In such cases, we reject the null hypothesis in favor of the alternative hypothesis, suggesting that there is evidence to support the claim or effect being tested.
When conducting hypothesis tests, researchers connect the p-value to this distribution through the use of the Z-distribution for large samples and the t-distribution for small samples. Moreover the p-value quantifies the likelihood of observing the data, given the assumptions made about the population distribution and the null hypothesis.
Conclusion
In the realm of Statistical Process Control, Bell curve plays a pivotal role in ensuring processes are stable, predictable, and capable of meeting desired specifications. Its symmetry and well-defined properties, including the mean, standard deviation, and the percentage of data falling within certain standard deviations from the mean, contribute to its utility.
This makes it an invaluable tool for setting control limits, analyzing process capability, and conducting root cause analysis.
By understanding and leveraging this distribution, industries can enhance their quality control efforts and reduce waste. Ultimately, this allows them to deliver products and services that consistently meet or exceed customer expectations.
Dariusz Kowalczyk