Ishikawa Diagram, also known as the “fishbone”, is a qualitative tool commonly used for problem-solving in production plants.
It is most often applied in quality areas, but it can also be successfully used in logistics, health and safety (ergonomics, workplace accidents, etc.), and production analysis.

Typically, it is used in the following contexts:
- 8D reports in step D4 for root cause analysis
- Kaizen methodology – where it is applied as 4M (Man, Machine, Method, Material) or 4M + 1D (Design)
It’s an excellent tool for correctly identifying the root cause of a problem, which directly influences the effectiveness of the solution. Additionally, the Ishikawa diagram is easy to learn and simple to use.
One key point to remember is that group problem-solving is a good practice, avoiding the pitfalls of a “one-man-show” approach. Over time, this individualistic strategy could lead to recurring problems and escalation to the OEM client.
Why is this important? Because the Ishikawa diagram fosters teamwork and stimulates creative thinking. Its added advantage is that it can be used immediately when a problem arises and at the location where it occurs (often referred to in the automotive industry as “gemba”).
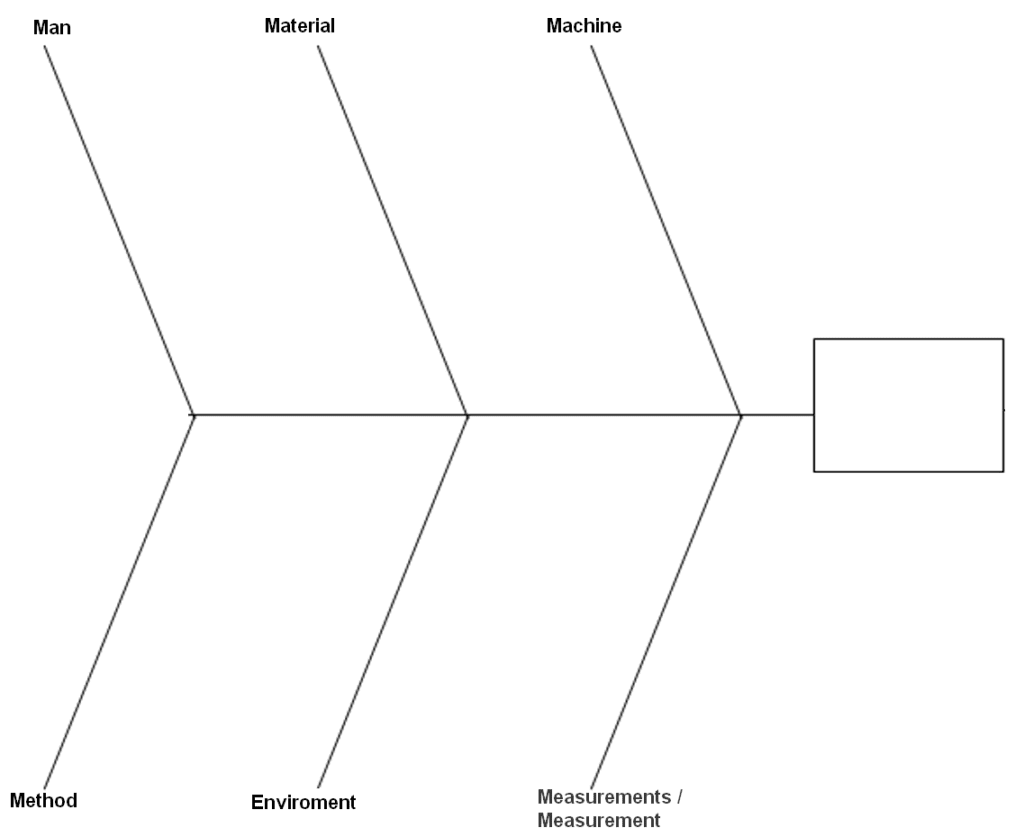
Ishikawa Diagram – Category Description
In the Ishikawa diagram, six categories are commonly considered:
- Man – This category examines qualifications, habits, job satisfaction, training, and the well-being of the person or employee whose actions led to the problem.
- Machine – This category looks into machine-related aspects such as licensing, durability, modernity, efficiency, precision, safety, and working conditions.
- Material – This refers to the components entering the production process and semi-finished products in the inter-operational areas (also known as WIP – Work in Progress).
- Method – This includes the verification of procedures, instructions, specifications, standards, laws, rules, know-how, and technology.
- Measurements / Measurement System – This category considers any issues with inaccurate or distorted readings from measuring instruments.
- Environment – This area addresses factors such as temperature, humidity, pressure, lighting, noise, and radiation.
For more information on the practical application of the Ishikawa diagram, we offer dedicated training courses on the 8D and Kaizen methodologies. We warmly invite you to join us.
Author: Dariusz Kowalczyk