The phrase “8D report template” usually does not show up when someone wants to read about the theory behind 8D.
Most of the time, it shows up when there is already a problem to deal with. The worst case is a customer complaint. A better one is an internal nonconformity.
That is the moment when you need to react, contain the issue, protect the process, and prepare a report that is more than just a document to send back.
That is where the template starts to matter.
A good 8D report template helps structure the team’s work. It does not solve the problem on its own, but it guides the team through each step of the analysis. It makes it easier to separate the problem description from the actual cause, immediate containment actions from permanent corrective actions, and facts from assumptions.
This matters because many 8D reports look fine at first glance. The fields are filled in. The dates are there. Names are listed. Sometimes there is even a 5 Why analysis. And still, a few weeks later, the same issue comes back.
Why?
Because having a form is not enough. The team also needs to know how to use it.
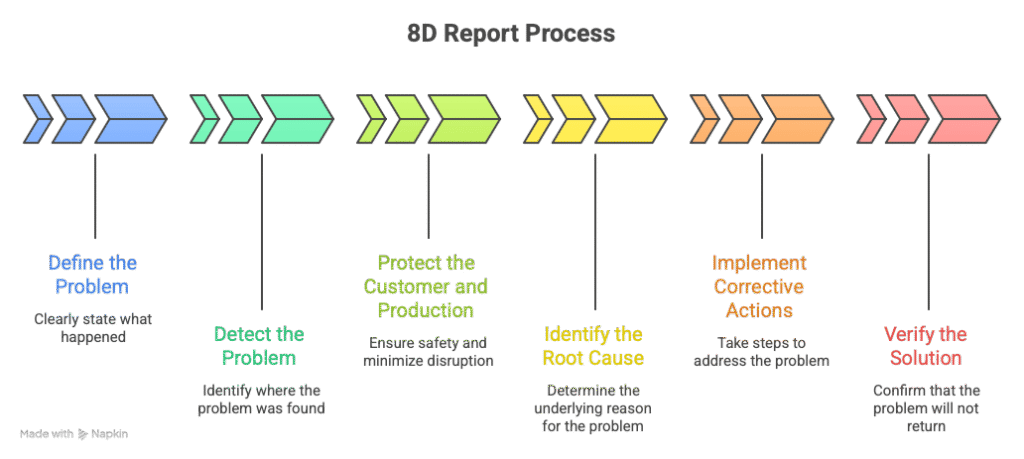
In practice, a good template should help answer a few simple questions:
- what exactly happened,
- where the problem was detected,
- how the customer and production were protected,
- what the root cause was,
- what actions were implemented,
- and how we know the issue will not come back.
If the form does not guide the team through that way of thinking, it quickly turns into blurred administration.
And that usually ends the same way: the report has been sent, but the problem has not really been closed. Sooner or later, that becomes obvious.
That is why choosing an 8D template is not about finding a file that looks “nice” or “customer friendly.” It is about having a form that helps the team go through the analysis step by step and does not skip the points that tend to come back later in an audit, a complaint, or another escalation.
What should a good 8D report template include?
A proper 8D template should not stop at the complaint description and a few boxes for actions.
It should guide the team through the full problem-solving process, from building the team all the way to closing the case.
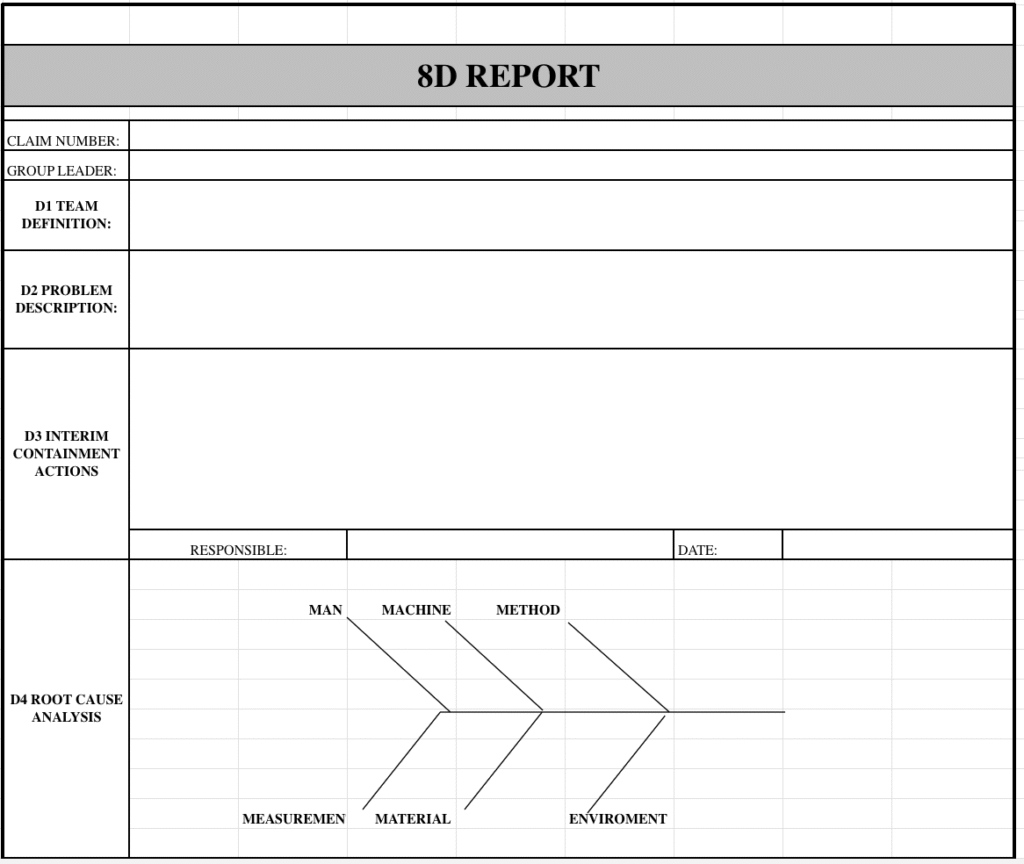
It starts with D1, the team.
This is not just a formality. When one person fills out the report alone, without input from process, quality, production, or maintenance, the analysis often stops at assumptions.
Then comes D2, the problem description.
This section should contain facts: what was nonconforming, where the problem was detected, which product or batch was affected, and what the actual symptom was. Without forcing the cause into the description. That is one of the most common mistakes. The diagnosis appears in the problem statement before the team has even started the analysis.
Next is D3, the containment action section. Depending on the company, this may also be called immediate action, correction, or temporary action.
This is where you describe what was done right away to reduce the risk. These actions address the symptom, not the root cause. Sorting, shipment blocking, 100% inspection, finished goods warehouse review, checking batches from the suspect time period — these are not actions that remove the cause. They are actions meant to stop the impact here and now.
After that comes D4, the root cause analysis.
This is where a good template really shows its value. It should include space for a 5 Why analysis, and ideally also a 6M structure. That way, the team does not wander from one guess to another. It works through the issue in a methodical way. Man, machine, material, method, measurement, environment — this structure helps make sure the obvious directions are not missed.
Once the analysis is done, the team moves to D5 and D6, which cover corrective actions, implementation, and validation.
This is not about writing down the first idea that comes to mind. It is about showing what exactly removes the cause of the problem, who is responsible for it, and how the team will know the action actually worked.
And a good template should not stop there.
It should also include D7, preventive action.
This is the part that is often missing in weak templates. If the lesson ends with one complaint only, the company learns too little. D7 should show what was changed on a broader level: in the FMEA, the Control Plan, work instructions, layered process audits, or in the review of similar processes through read across.
Finally, there is D8, problem closure.
Not as a polite “thank you, team,” but as confirmation that the actions were implemented, effectiveness was verified, and the case can be closed without leaving open gaps behind.
That is exactly why a good 8D report template is not just a simple form for typing in a few sentences.
It should be a working document that helps the team move through the analysis in a logical order and keeps these things clearly separated:
- the symptom from the cause,
- immediate actions from permanent actions,
- implementation from effectiveness verification.
Download the free 8D report template in Excel and use it to work through your problem analysis step by step.
How to Fill Out an 8D Report Step by Step
The template alone does not solve the problem.
Whether an 8D report actually makes sense only becomes clear when the team starts filling it out. That is the moment when you can see whether the team is really analyzing the issue or just trying to close the complaint as quickly as possible.
Below is a simple way to work through an 8D report without mixing up the symptom, the cause, and the actions.
Start with facts, not theory
The first mistake usually happens very early.
The team receives information about the problem and immediately tries to answer the question: “Why did this happen?”
But at the beginning, you do not have the cause yet.
You only have the symptom.
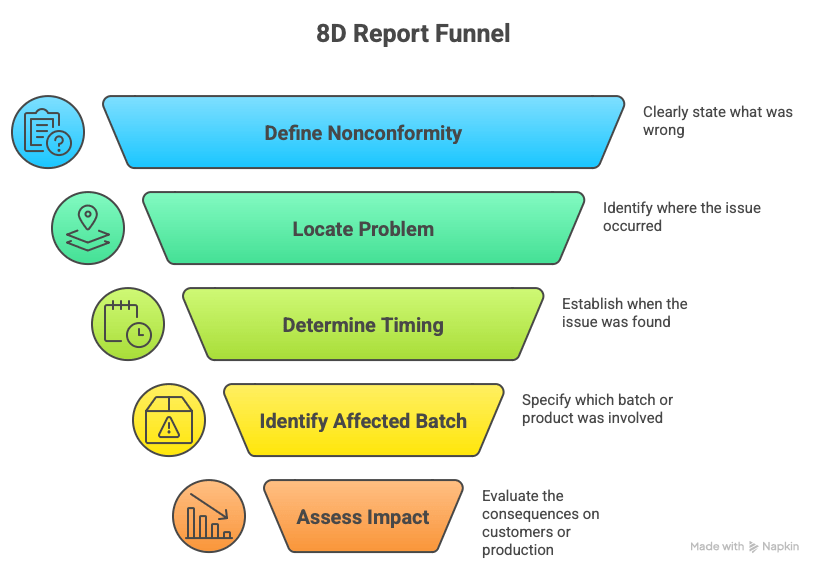
That is why the 8D report should start with the facts clearly organized:
- what exactly was nonconforming,
- where the problem was detected,
- when it was detected,
- which batch, product, or process was affected,
- what the impact was on the customer or production.
In D2, you do not write assumptions.
You also do not use convenient shortcuts such as “operator error” or “machine setting issue” unless that has actually been confirmed.
A good problem description should read like a record of what happened, not like a diagnosis.
Instead of writing:
“The problem was caused by incorrect process adjustment.”
it is much better to write something like:
“During customer inspection, a nonconformity of dimension X was found in 12 parts from batch Y. The issue was linked to production from day Z.”
That keeps the next stage of the analysis anchored in facts.
First protect the customer and the process
Only after the problem has been clearly described do you move to D3, the containment actions.
At this stage, the goal is not to remove the cause.
The goal is to stop the effect and reduce the risk.
In practice, that may include:
- shipment blocking,
- warehouse sorting,
- 100% inspection,
- segregation of the suspect batch,
- additional checks on work in progress,
- informing the customer about the scope of the risk.
These are temporary actions.
They do not fix the process.
They buy the team time, protect the customer from another nonconformity, and help limit the cost of the issue.
This is also where many reports start to lose consistency.
The team puts something into D3 that really belongs in D5 or D7. As a result, the report may still look acceptable, but the logic behind the actions starts to fall apart.
D3 should answer one simple question:
What did we do immediately to stop the issue from spreading further?
Only then look for the root cause
Once the symptom has been contained, you can move to D4.
This is where the real analysis begins.
At this point, the template should help the team, not get in the way. If it includes 5 Why and 6M, that is a good sign. That structure helps organize thinking and pushes the team to check several directions instead of jumping on the first convenient explanation.
A solid analysis usually looks like this:
- the team gathers data,
- reviews the process,
- compares the standard with what actually happened,
- identifies where the system allowed the problem to occur,
- confirms the cause instead of guessing it.
The worst shortcut is writing:
“Cause: operator error.”
That is usually not a root cause.
It is just a label.
You need to go one level deeper. For example:
- why did the operator make the mistake,
- why did the standard not prevent it,
- why did the control system fail to detect it,
- why could the process parameters be set outside tolerance,
- why was the risk not captured earlier in the process FMEA or the Control Plan.
That is the point where the report starts to say something useful.
Do Not Mix Up D3, D5, and D7
This is one of the most common problems in 8D reports.
The team has several actions listed, but it is not clear which one is temporary, which one removes the cause, and which one is meant to protect the system on a broader level.
The easiest way to separate them is this:
- D3 – you stop the problem here and now, which means you act on the symptom, the issue reported by the customer
- D5 – you remove the cause of the problem
- D7 – you protect the process and similar areas so the same issue does not come back somewhere else
For example:
- 100% sorting of finished goods — that is D3
- changing a process parameter after confirming the cause — that is D5
- updating the FMEA and Control Plan for similar processes — that is D7
If everything is thrown into one bucket, the report becomes hard to assess and even harder to defend in front of the customer.
In D5, Describe What Really Removes the Cause
The D5 section should answer one very specific question:
What did we change so that this cause cannot create the same problem again in the same way?
This is not the place for vague statements.
Instead of writing:
“The operator was retrained.”
it is much better to write:
“The fixture setting instruction was updated, a verification point was added after changeover, and the setup was confirmed by the shift leader.”
Then it becomes clear:
- what was changed,
- where it was changed,
- who is responsible,
- how it works in practice.
Training on its own rarely closes the issue.
If it is not followed by a change in the standard, the control method, or the way the process is organized, the problem often comes back under a different name.
In D6, Show Implementation and Validation
Writing down a corrective action does not finish anything.
In D6, the team needs to show that the action:
- was implemented,
- works in practice,
- and was verified.
That may include:
- measurement results after the change,
- no further nonconformities over a defined period,
- confirmation from a process audit,
- results of additional checks after implementation,
- comparison of the situation before and after the change.
Without that, the report looks as if the team only promised improvement.
And the customer usually does not want a promise.
They want evidence that the situation is under control.
D7 Is Not an Extra. It Is System Protection
In many reports, D7 is treated as an afterthought. Most often, it is reduced to a short note about updating the PFMEA and the Control Plan.
One sentence appears, and the topic is considered closed.
But this is exactly the point where you can see whether the organization has really learned from the problem.
D7 should show what was changed more broadly:
- whether the FMEA was updated,
- whether the Control Plan was improved,
- whether work instructions were revised,
- whether a new point was added to layered process audits,
- whether a read across was done for similar lines, cells, or products.
If the issue was removed only in one local area, it can still appear somewhere else.
And then the 8D report may be formally closed, while in practice very little has changed.
At the End, Check Whether the Case Can Really Be Closed
D8 should not be just the closing section of the document.
It is the moment when the team honestly answers a few questions:
- were the actions actually implemented,
- was effectiveness confirmed,
- was the risk reviewed on a broader scale?
If there is no confirmation of effectiveness, the case is not really closed.
It has only been postponed.
That is why a good 8D report template should guide the team from the facts, through containment, analysis, actions, and verification, instead of simply giving people empty boxes to fill in.
Dariusz Kowalczyk