If you work with warranty claims, you know that return data is a goldmine of knowledge. The only challenge is figuring out how to extract valuable insights from it. That’s where the Weibull analysis comes into play – a mathematical game-changer for anyone who wants to understand when and why parts start to fail
Weibull analysis should be applied by organizations when the probability of failure changes over time. In practice, this method is used to address issues that do not manifest immediately in production plants (e.g., during PPAP tests) but start to occur in the warranty field.
When Should Weibull Analysis Be Applied?
Organizations should conduct a Weibull analysis when they receive information indicating an increased occurrence of problems in the warranty field. This approach helps assess the risk and predict potential failures over time.
Key Parameters of Weibull Analysis
The Weibull distribution can take various forms, depending on its parameters. For example, it can resemble a normal distribution or an exponential distribution (where k=1k = 1k=1). The k-parameter determines how the probability of failure behaves over time and can be categorized as follows:
- k<1: The probability of failure decreases over time.
- k=1: The probability of failure is constant, suggesting that failures are external random events (exponential distribution).
- k>1: The probability of failure increases over time, indicating that parts degrade and lose functionality as time progresses.
Why Use Weibull Analysis?
The primary reason for using this analysis is to provide customers with a risk assessment of potential defective components that may still fail during the warranty period.
Two main factors are considered in the analysis:
- Mileage: The distance after which the final customer noticed the system’s improper functioning.
- Time: The period after which the problem was observed by the final customer.
Assumptions
Each analysis should be tailored to the specific context. However, some commonly used assumptions include:
- European Market: Average daily mileage is 50 km.
- Japanese Market: Average daily mileage is 30 km.
- USA Market: Average daily mileage is 150 km.
If the organization has a large sample of defective components, it can estimate the average daily mileage. This information allows for predicting the number of defective parts relative to the warranty period’s duration and mileage.
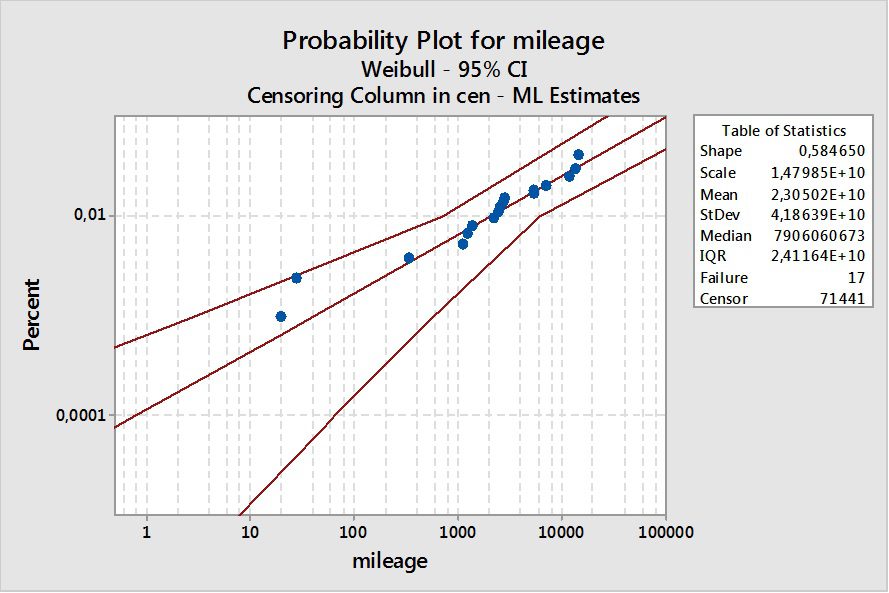
Outputs
The outcome of the Weibull analysis should provide a range indicating the minimum and maximum quantity of defective units still in the field. This information enables both the client and the organization to determine appropriate next steps. The analysis is typically supported by visual tools such as charts for easier interpretation.
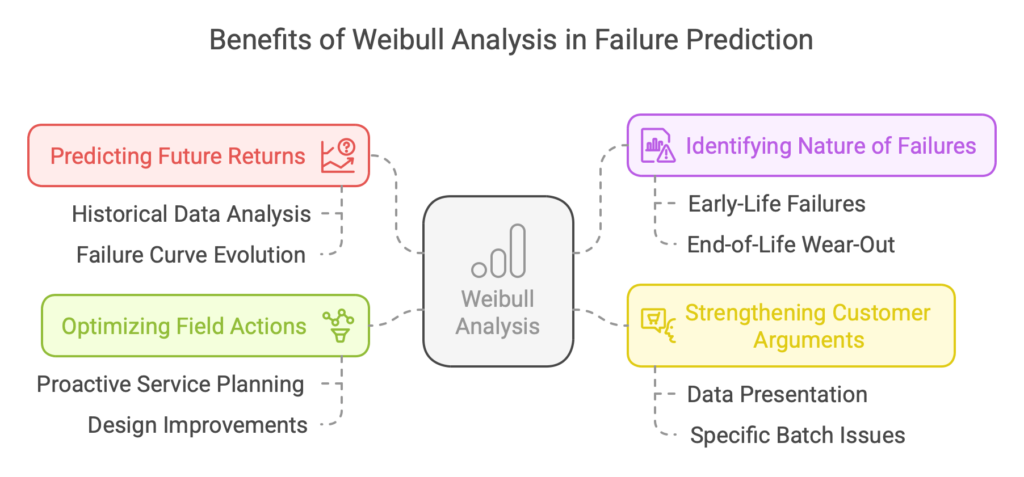
What are the benefits of using the Weibull analysis?
Predicting future returns
Want to know if a sudden spike in claims is just a random event or the beginning of a serious issue? By analyzing historical data, Weibull helps you predict how the failure curve will evolve in the coming months. This gives you time to react before the problem spirals out of control.
Identifying the nature of failures
Are the failures caused by a production defect, or are they simply the result of normal wear and tear? By analyzing the shape of the Weibull curve, you can determine whether you’re dealing with early-life failures, random breakdowns, or end-of-life wear-out. That’s a critical input for root cause analysis.
Stronger arguments in customer discussions
Nothing works better in talks with an OEM than hard data. Instead of saying “it just happened,” you can present a Weibull-based analysis showing that the product has stable quality, and the issue only affects a specific batch. Data speaks louder than words.
Optimized field actions
If you know that most failures happen within the first few months, you can plan proactive service actions. If the failures only appear after several years, it may be smarter to focus on design improvements instead of tightening in-plant controls.
Learn More
For more information and practical examples, consider participating in dedicated training sessions on Weibull analysis.
Download our free ebook Automotive Warranty Management – Practical Guideline for Suppliers
 Author: Dariusz Kowalczyk
