In the case of quality problems that are not isolated occurrences, clients or organizations may require a risk assessment related to the potential population of non-conforming products. One such assessment is the PPM analysis (Parts Per Million), which evaluates the quantity of affected parts in relation to one million manufactured parts.
The undeniable advantage of PPM analysis is that it can be used to conduct risk assessments for both units reported from the customer’s production plants (0-km) and warranty claims. Organizations most often apply this method in the following situations:
- Inability to use process data that could help define the affected population.
- Changes to drawing values during the production process without the possibility of reconstruction (e.g., changes to the shaft diameter on which bearings are pressed).

Another benefit of PPM analysis is that it does not require specialized software, such as for Weibull analysis. A standard Excel form is sufficient.
PPM Analysis – Assumptions
Each risk analysis is based on a set of assumptions that must be documented when preparing the analysis. These assumptions should be included in the documentation shared with the client or internally within the organization.
In the case of PPM analysis, key assumptions include:
- Start Date: This defines the beginning of the problem. If this cannot be precisely identified, the start date is equal to the Start of Production (SoP) for the particular project.
- Closing Date: This corresponds to the introduction date of permanent corrective actions (PCA).
These two dates serve as the cut-off points for defining the time range considered in the risk assessment.
Additional considerations include:
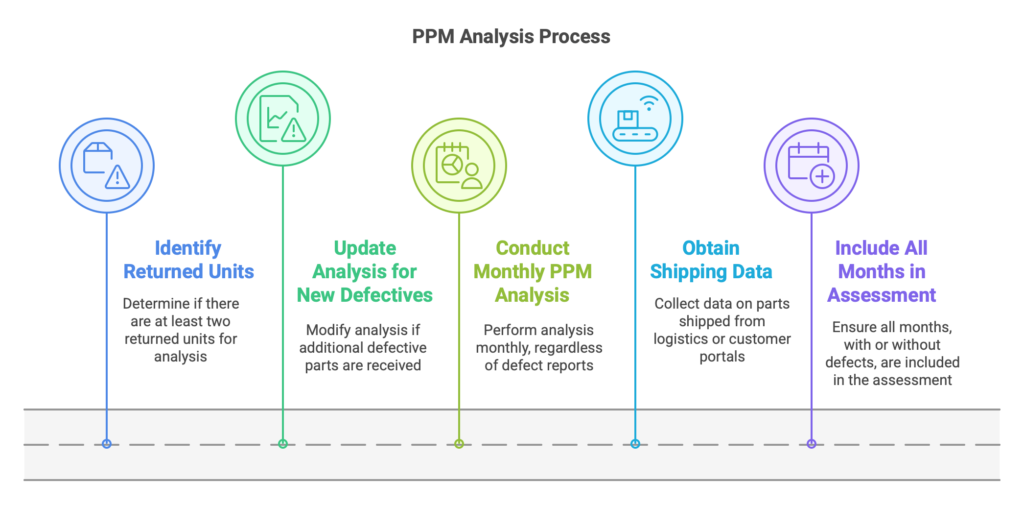
- PPM analysis can be applied to a minimum of two returned units. Complaints involving only one returned unit are treated as “single occurrences.”
- The analysis requires updates if additional defective parts are received for evaluation.
- PPM analysis is conducted on a monthly basis. For each month included in the assessment, data about the number of parts shipped must be obtained from the logistics department or customer portals. This includes months with no reported defective parts as well as those where non-conformities were identified by the customer.
PPM Analysis – Form Overview
In this risk assessment, four key columns are used:
- Month
- Returned Units: Assigned to individual months.
- Shipped Units: Quantities shipped during each month.
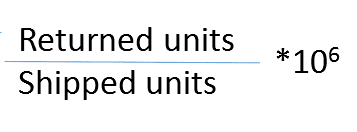
- PPMs Counted: Calculated for months where no problems were identified. The formula for this factor is as follows:
Below is an example illustrating the discussed form. The start date is July, and the end date is March, covering a total of nine months.
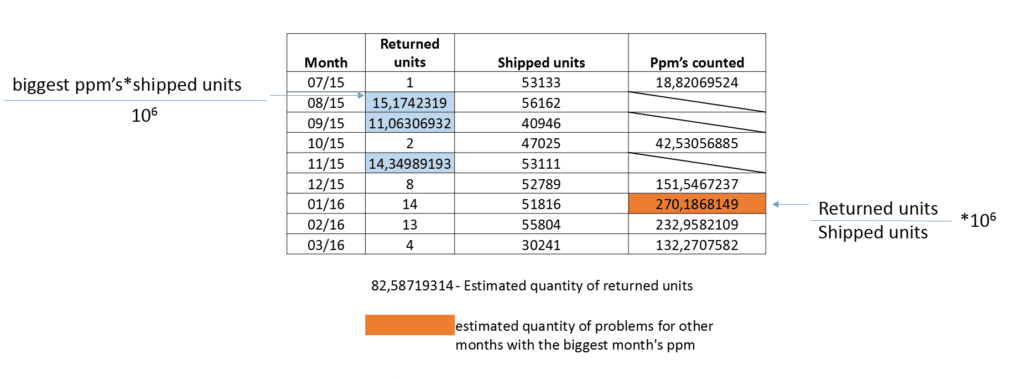
The number of returned units is recorded for the following months: July, October, December, January, February, and March—a total of 42 units. For the remaining months, PPM values are calculated based on the results in the “PPMs Counted” column.
In the “Shipped Units” column, the monthly quantities are obtained from the logistics department or customer portals. The “PPMs Counted” column is used to calculate values for months where defective units were reported.
The most critical step in the PPM analysis is identifying the highest value from the “PPMs Counted” column to use as the “worst-case scenario” in subsequent steps.
The final stage involves calculating PPM values for the months of August, September, and November using the following formula:

Based on these calculations, the total number of potentially affected parts is 82.58, rounded up to 83.
By this, we can calculate the final number of parts that will be considered in the risk assessment. In the above case, the number is equal 82.58 and must be rounded to 83.
Customer Communication
In documentation provided to the customer (OEM), it is recommended to include a statement noting:
- The potential number of affected units is 83.
- Currently identified defective parts: 42.
- Potentially remaining parts in the warranty field or customer plant: 41.
Download our free ebook Automotive Warranty Management – Practical Guideline for Suppliers
 You can download an automatic, editable Excel form for free on the Free Quality Tools
Document name: PPM analysis – Risk Assessment method for 0-km claims and warranty returns – Excel form
Author: Dariusz Kowalczyk