IPTV is one of the main warranty indicators that allow the organization to properly assess the effectiveness of the implementation of actions after analyzing the parts from the field. Additionally, it gives us the opportunity to analyze trends, which allows for earlier reaction in the event of an increase in the number of market returns.
The term IPTV stands for “Incidents Per Thousand Vehicles” produced and sold to the final client. This does not necessarily imply a warranty return.
What is the starting point for defining the target for IPTV?
The collaborative efforts between the client’s and the organization’s engineering teams define the starting point for this indicator. This is typically outlined in the Reliability Plan.

It corresponds to the implementation of requirement 1.4: Product and process assumptions in relation to Advanced Product Quality Planning (APQP). However, from the IATF standard point of view, the Reliability Plan is included in requirement 8.3.5.1. Design and development outputs – supplemental.
Where to Find IPTV Targets?
To answer this question, we need to take a broader look at this indicator. It functions inseparably within a given period of time known as MIS – Months in Service. Therefore, whenever we talk about IPTV, we must specify whether we are considering the period: 3 MIS, 6 MIS, 12 MIS, or another.
We can find the IPTV goal directly in the contract signed between our organization and a given client. Most often, it will not be available at the organization’s production location, only in the sales department. It is defined very often as Remote Location.
Additionally, you can find information about goals directly in the relevant customer documentation or on the client portal.
How to Interpret a Chart Correctly?
Correctly interpreting data requires some skill. This is because the corresponding IPTV charts for 3 MIS, 12 MIS, etc., are properly spaced from each other, taking into account the appropriate rule.
For example:
If we collected data for the month of December 2023, we will have the latest information for individual months in the following periods:
- 3 Months: September 2023. This means that in this month, we have information available on all incidents for sold vehicles, including October, November, and December. The same principle applies to other time periods.
- 12 Months: We will have the latest data available for cars sold in December 2022.
- 24 Months: We will have the latest data available for cars sold in December 2021.
How to use IPTV to check the effectiveness of implemented actions?
IPTV gives us a great opportunity to check whether what we have implemented is effective. It is done by analyzing trends as in the example below.
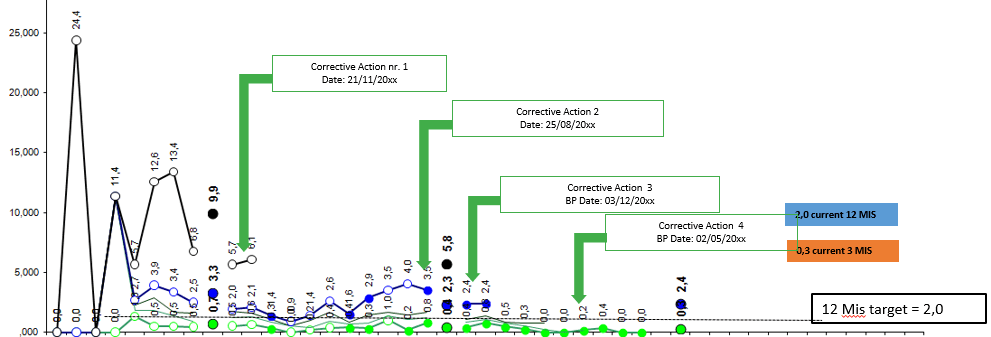
After implementing appropriate actions, we notice a gradual decrease in the number of incidents. This means that our implemented actions were effective.
However, we must remember one element here. We cannot chart activity dates in the same timeline as IPTV. Why? This is due to the fact that a certain number of days pass from the time our organization produces a given component, transports it, OEM installs it in a car and sells the vehicle to the customer.
The simplest solution is to implement an off-set, i.e. the interval between the date of sale of the vehicle and the date of the implemented actions. A reasonable solution is to postpone it by 3 months. For example, if we consider December 2023 from the IPTV point of view, we place the action that was implemented at that time on the timeline in September 2023.
Why is IPTV 3MIS period is so important for the customer?
The answer is as follows: the customer makes a simple assumption (and rightly so) that if problems begin to intensify during 3 months of using the vehicle, they will become more severe after 12 or 24 months of using the vehicle by the customer.
If such a situation occurs, the client will most often contact people from our organization to conduct an appropriate analysis.
How to interpret the data?
During the first months of data collection, the trend graph typically shows a higher level than it does after one or two years.
This is due to the fact that the same number of incident occurrences with a lower volume will generate higher IPTV values. Therefore, it is important to interpret the data correctly.
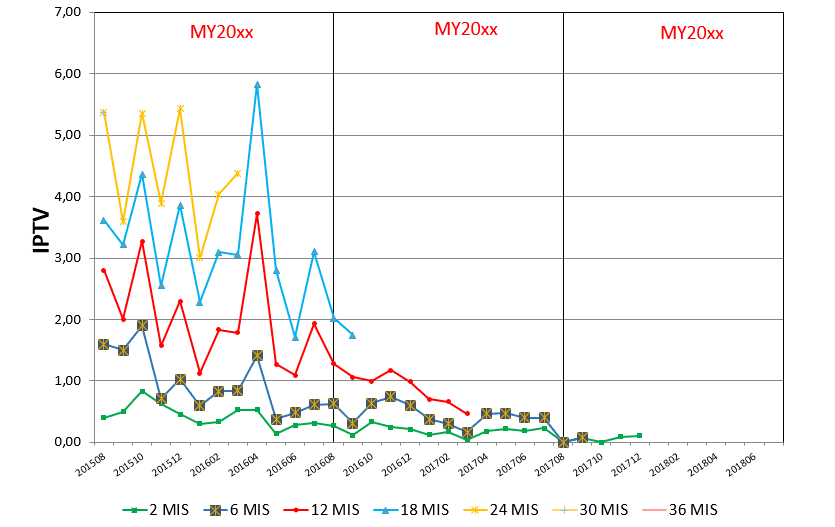
A similar situation may occur in the months after the holiday season. There are fewer appearances in July and August months. September, however, may manifest higher values. This is due to the fact that customers usually postpone potential car inspections at dealers until after the holidays.
Additionally, remember that IPTV does not equal the number of warranty returns. Therefore, if a peak occurs over a period of one or two months, it is worth checking the data in detail. If the client raises such a question, we need to ensure we have received the necessary number of field returns for analysis during this period.
IPTV in relation to requirements for management review
As part of the management review, we analyze warranty returns results, if applicable, as one of the inputs. This requirement can be found in the IATF standard – 9.3.2.1 Management review inputs – supplemental. Subsection h).
In this section, the organization typically provides information on the number of returns it has received from the field and how many of them it has analyzed. However, the indicator related to the number of incidents per 1,000 cars sold is often overlooked.
What IPTV names you may come across when working with clients?
When working in the automotive industry, we must be aware that customers may have different terms for a warranty trend chart. Below are some examples.
- R1000 in cooperation with Ford client
- C1000 in cooperation with Stellantis xFCA
- 1000 FZG in cooperation with VW
- BMW, on the other hand, calculates them in relation to 100 vehicles sold
And if you want to learn more about IPTV in relation to the analysis of warranty returns, we cordially invite you to our dedicated training Automotive Warranty Management.
Dariusz Kowalczyk