Quality KPIs are one of those topics that seem simple in theory. You have a table, a few numbers, green and red boxes, a month-to-month trend — and it looks like everything is clear.
But in the automotive industry, it quickly becomes obvious whether those numbers reflect real process control or just a report prepared for a meeting. A company can have a “nice” dashboard and still spend its time firefighting on the shop floor, responding to customer complaints, and explaining problems that should have been detected much earlier. There is a reason people say that paperwork can make everything look fine.
That is exactly why quality KPIs keep coming back as a recurring topic in every manufacturing company. They appear during management reviews, monthly leadership meetings, audits, complaint discussions, customer reviews, and supplier evaluations. In all of these situations, one simple question comes up again and again: do we really have this area under control?
In most cases, the problem is not that a company measures nothing. More often, it is the opposite — too many things are measured, but not always the ones that actually support decision-making. Sometimes a KPI is poorly defined, or no one is fully sure what it really means. Sometimes the result is reported every month, but there is no clear reaction plan when the trend starts moving in the wrong direction. And sometimes everything looks correct in Excel, yet the problem still reaches the customer.
In this article, you will learn:
how to understand quality KPIs in the automotive industry,
how to choose them for a specific area,
which KPIs are most commonly used in customer quality, process quality, quality management systems, and supplier quality,
and how to interpret the results so they lead to meaningful action.
Because a KPI alone does not solve anything. It only shows where you need to look deeper.
What Are Quality KPIs and Why Are They Measured in the Automotive Industry?
Simply put, a quality KPI is a number used to show whether a specific area is performing as expected. It sounds straightforward. In practice, however, that number carries real weight, because it drives questions, decisions, escalations, and corrective actions.
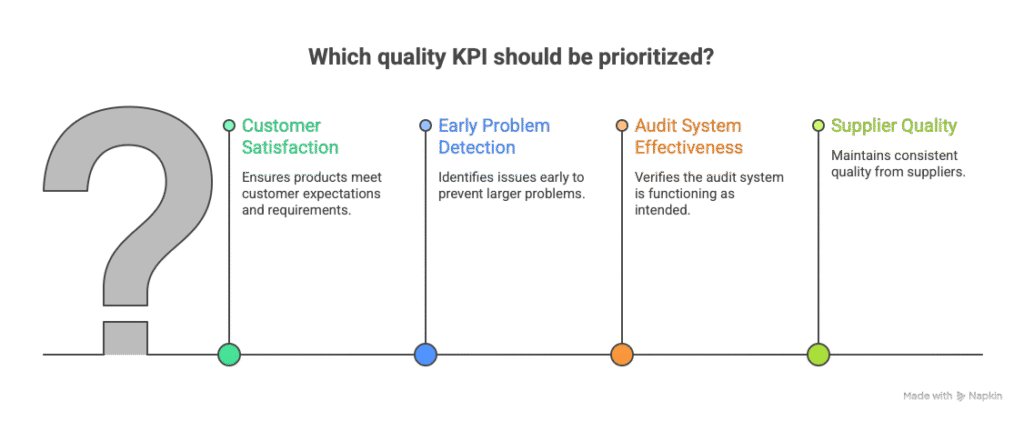
In the automotive industry, a quality KPI cannot be just a number reported for the sake of reporting. It has to answer a specific question. For example:
Is the customer receiving a product that meets all requirements?
Is the process detecting problems early enough?
Is the audit system working according to plan?
Is the supplier maintaining the level of quality you expect?
A well-chosen KPI helps identify risk early, verify whether actions are effective, and focus attention on the areas that truly need improvement. A poorly chosen KPI, on the other hand, creates a false sense of control. And that is where many companies run into trouble.
This is where the first major issue usually appears in many companies. Measuring something does not automatically mean managing it. You can report PPM, the number of complaints, or calibration completion rates every single month and still have no real control over the situation if nobody analyzes root causes, monitors trends, or triggers action when the results start to decline.
A Quality KPI Should Trigger Action
A good KPI works like a warning light in a car. It does not solve the problem by itself, but it signals that something inside needs to be checked. If the warning light is on and you simply cover it with tape, the car will not start running better. Quality KPIs work in exactly the same way.
If the number of customer complaints is increasing, the point is not just to enter a higher number into the report. You need to ask a few simple questions:
Does the problem affect one product or several product groups?
Are the complaints coming from one customer or from several customers?
Is the issue related to the process, measurement, reaction management, or perhaps the supplier?
A KPI is therefore a starting point. It shows where to look. It does not replace analysis.
In Automotive, Every Number Needs an Owner and a Reaction Plan
The second issue is this: a KPI without an owner quickly becomes nothing more than a decoration on a slide. It is there, someone presents it, but once the result becomes weak, the usual response starts: “this is not really our area.”
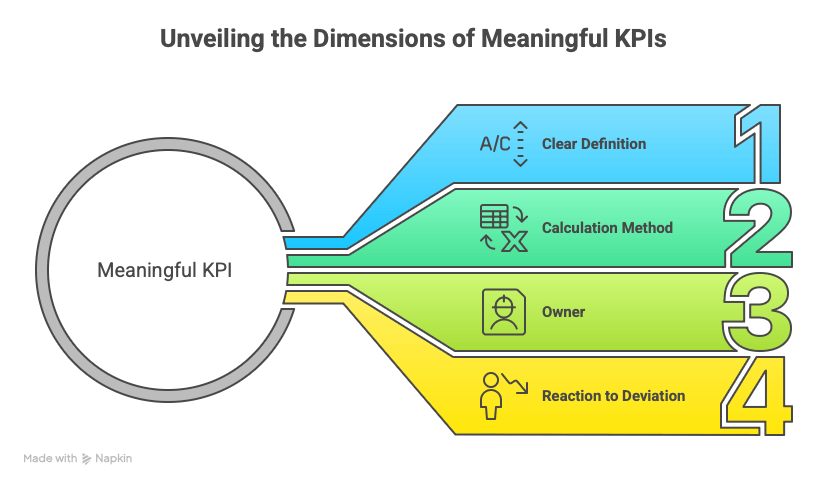
That is why a meaningful KPI should always include four elements:
a clear definition,
a calculation method,
an owner,
and a defined reaction to deviation.
If a KPI does not have these four elements, it often ends up functioning only as a reporting figure rather than a real management tool.
Without this, dysfunction starts to appear. One person calculates PPM one way, another does it differently. One assigns a complaint to the month it was reported, another to the month it was closed. One treats an overdue calibration as a problem, while another says it is “still acceptable.” And then everyone sits in a meeting discussing not quality, but which spreadsheet is the correct one.
A good practice is to include the KPI in the process map or process sheet, which can be developed based on a Turtle Diagram or SIPOC.
Not Every KPI Shows the Same Thing
This is also important, because in practice people often put everything into one category called “quality KPIs.” In reality, however, different KPIs show different things.
Some reflect the final result, such as customer complaints or PPM. Others show whether the system is working according to plan, such as the completion of internal audits. Still others indicate whether the process has the foundations for stable performance, such as calibration on-time completion or laboratory testing on-time completion.
A low PPM alone does not tell you whether reaction processes on the shop floor are well organized. Completing the audit plan alone does not tell you whether audits are actually focused on real issues. And the percentage of calibrations completed on time does not answer the question of whether the measurement method is truly effective in practice.
Why Do Companies Measure Quality KPIs?
The reason is simple: to detect problems earlier, assess the level of risk, and avoid making decisions based purely on intuition.
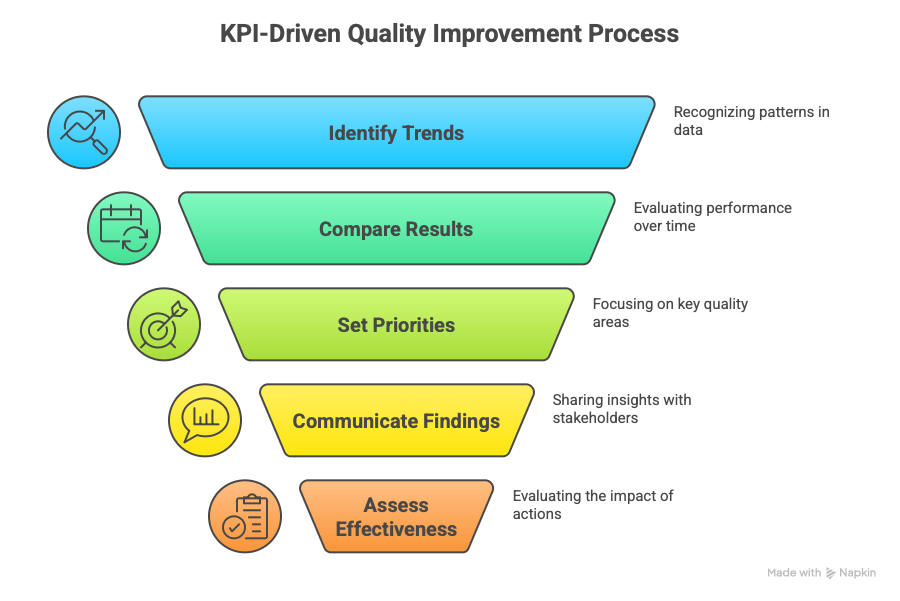
In a well-structured environment, KPIs help companies to:
identify a worsening trend early,
compare results month by month,
set priorities for quality actions,
show customers or management what is happening in the process,
assess the effectiveness of actions taken after complaints, audits, or supplier-related issues.
A well-selected KPI does not just show whether something has already gone wrong. It also helps indicate whether the situation is starting to move in the wrong direction — before the problem becomes visible to the customer.
This matters especially in the automotive industry, where customer requirements, time pressure, and the expectation of fast reaction all go hand in hand. When you do not have a clear picture of the situation, you start acting after the fact. First, the problem appears on the shop floor or at the customer, and only later does the company try to understand what it missed earlier.
Where Do Companies Fail Most Often?
Usually, not in the measurement itself. They fail in the interpretation.
An example? A company reports 100% completion of audits according to the plan. It looks good, right? But a moment later it turns out that post-audit actions have been stalled for three months, and the same nonconformities are reappearing on other production lines.
Or take another situation: a low number of official customer complaints. Great. Except that at the same time, the number of “informal” issues, expedited sorting activities, and emails asking “please explain” is increasing. The table looks calm, but the customer relationship no longer does.
That is why, when it comes to quality KPIs, you always need to look beyond the result itself. A number only becomes meaningful when you can see its background, its trend, and its consequences.
What Is the Real Purpose of Quality KPIs?
It is not about making sure the report “looks right.” The real purpose is to know:
whether the process is operating in a stable way,
whether the system detects problems early enough,
whether the customer is starting to lose patience,
whether suppliers are maintaining the level you expect,
whether the quality department has control over the areas it is supposed to supervise.
If a KPI helps answer these questions, it makes sense. If it exists only because “it has always been in the report,” sooner or later it will start taking up space instead of providing value.
First the Process, Then the KPI
A good KPI does not come out of nowhere. It should result from the process that someone is responsible for.
If you supervise customer quality, you will naturally look at:
the number of official complaints,
PPM,
customer satisfaction.
If you are responsible for the quality management system, the logical KPIs will include:
completion of the system audit plan,
completion of the process audit plan,
on-time closure of post-audit actions.
If your role is closer to the shop floor and process quality, the list expands to include:
on-time calibration completion,
on-time laboratory measurements,
completion of finished product audits,
timeliness of control plan reviews.
And if we are talking about supplier quality, then the focus immediately shifts to:
supplier complaints,
supplier PPM,
cost recovery rate — in other words, the percentage of costs successfully recovered from complaints raised against sub-suppliers.
This approach helps bring order to the topic. First, you define which area needs to be under control. Only then do you choose the number that will signal whether that area is performing well or starting to drift out of control.
One KPI = One Question
This is the point where many companies start making life unnecessarily difficult for themselves. A KPI should answer one specific question. For example:
Is the customer reporting more and more official problems to us?
Are our measuring devices being calibrated on time?
Are internal audits being carried out according to plan?
If one KPI tries to answer three things at once, then after a month nobody really knows what it is supposed to say.
Here is a simple test: if, after reading the name of a KPI, you still need to spend five minutes explaining what it actually means, then something has been set up the wrong way.
Every KPI Needs an Owner
Without an owner, a KPI quickly turns into just another number “for information only.” On paper, everything looks fine. We have a result and a trend. But the moment someone asks, “who is supposed to do something about this?”responsibility starts spreading into every corner.
That is why, for every KPI, you should clearly define:
who is responsible for it,
who calculates it,
who analyzes the trend,
who triggers the reaction when the result is outside the target.
This does not necessarily have to be one person. But the responsibility must be clearly assigned. Without that, everyone sees the red box during the KPI review, yet nobody feels the issue belongs to them.
The Result Alone Is Not Enough — You Need a Reaction
This is probably the element most often overlooked. Companies can describe in great detail how a KPI should be calculated. They can set a target. They can create a chart. But then they have no defined response for what should happen when the result starts to drop.
And that is when the KPI begins to work like a thermometer without a doctor. It shows that there is a problem, but nothing happens next. For each KPI, there should be at least three defined levels:
the expected level,
the warning level, if used,
the level at which escalation or specific actions must be triggered.
A practical example: if calibration on-time performance drops below the defined level, what do you do?
Do you check individual gauges? Do you block the use of equipment without valid calibration? Do you review the measurement equipment management system? Do you involve the laboratory and production?
If this is not defined, then the KPI becomes nothing more than historical information.
Not Every KPI Needs to Be Reported at the Same Frequency
This is another area where it is easy to overdo it. Some KPIs make sense on a monthly basis. Others are better reviewed weekly. And some are perfectly fine on a quarterly basis, as long as there is no signal that something is starting to go wrong.
For example:
customer complaints and PPM usually make sense in a monthly cycle with trend monitoring,
timeliness of laboratory testing or calibration can be tracked more frequently,
audit plan completion is often reviewed monthly or quarterly,
supplier cost recovery usually needs a longer time horizon, because the recovery process itself takes time.
If you put everything into the same reporting period, some KPIs will be updated too often, while others will be reviewed too late.
A Good KPI Can Be Calculated Without Debating What the Author Meant
It sounds obvious, but this is exactly where things often start to fall apart. Take a simple example: “number of customer complaints.” Immediately, several questions appear:
Are we counting only official complaints, or also issues raised by the resident engineer?
Do we count them by the date they were reported or by the date they were confirmed?
If a complaint was withdrawn after analysis, does it stay in the KPI or not?
And what if the customer has three months to make a decision, but we need to report the annual result in two weeks?
The same applies to PPM, audits, cost recovery, and the timeliness of control plan reviews.
That is why the KPI definition should be written in normal, clear language. A new person in the department should be able to read it and calculate the result in exactly the same way as everyone else.
It Is Better to Have Fewer KPIs and Actually Know What They Mean
In practice, a small set of well-designed KPIs works much better than a dozen numbers that nobody analyzes later.
If, for a given area, you have:
a meaningful definition,
an owner,
a review frequency,
a defined reaction to deviation,
and a trend,
then that KPI starts to become a real management tool. You can work with it. You can use it as a basis for discussions with production, with the supplier, with the customer, or with management.
If quality KPIs exist only because they are “supposed to be in the report,” sooner or later they become background noise. Everyone sees them, but nobody takes them seriously.
Dariusz Kowalczyk